Charts
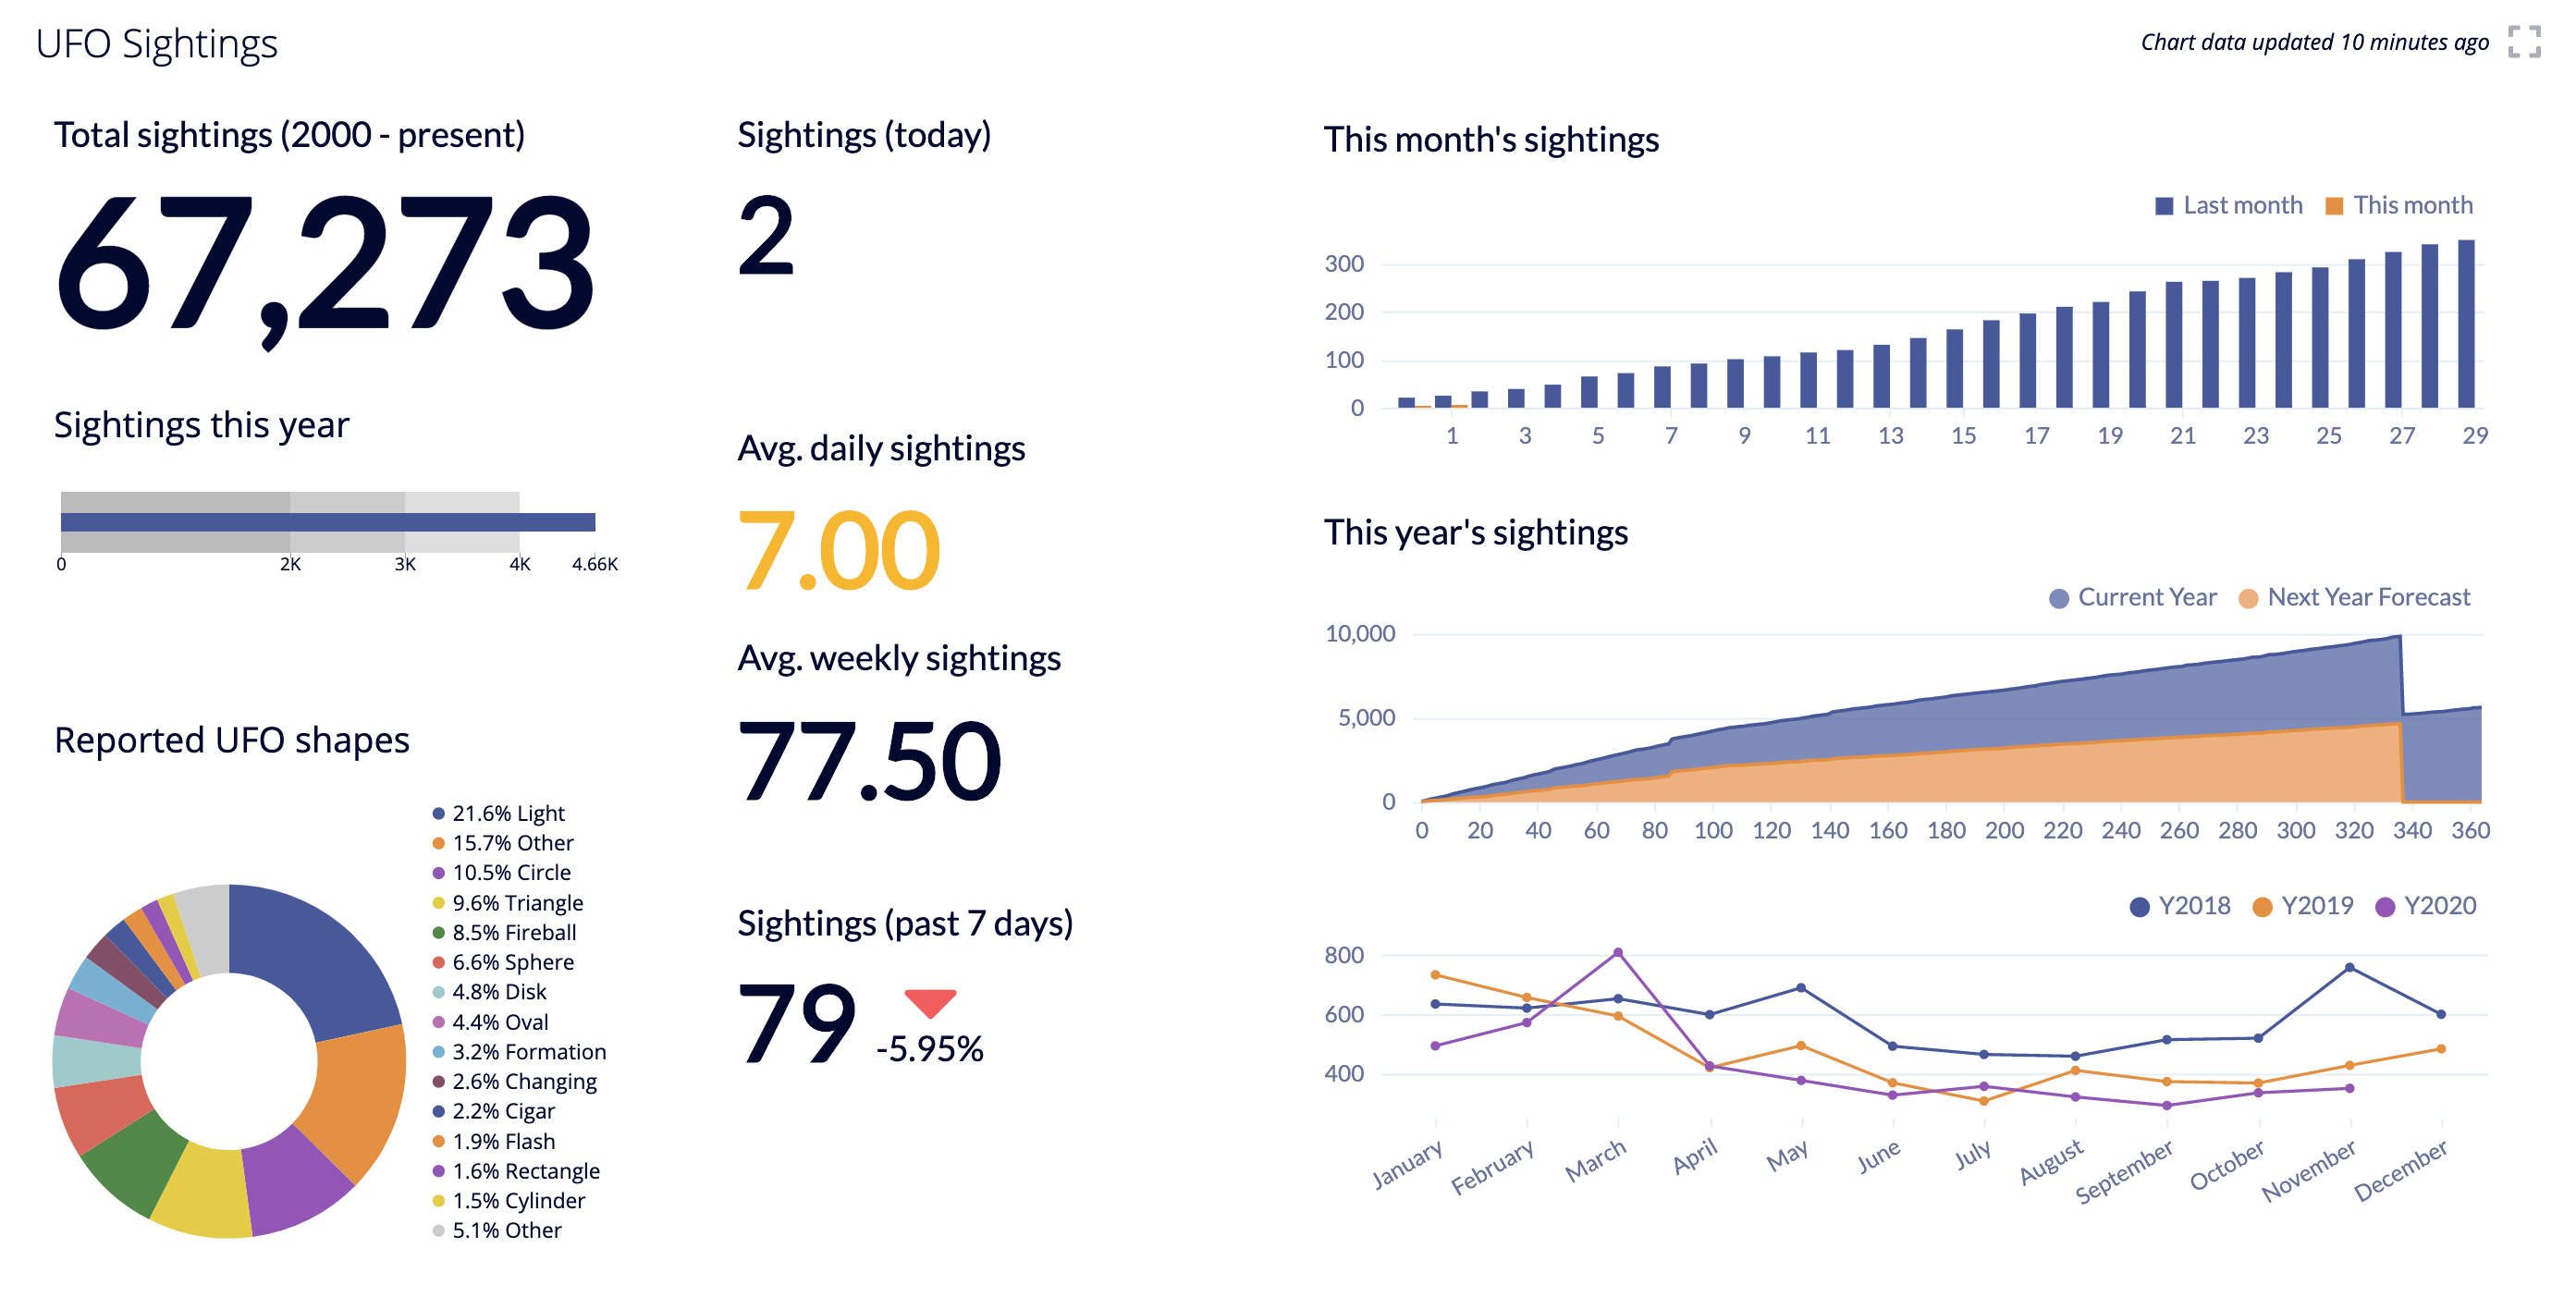
Charts are the building blocks of Chartio. This section highlights the different types of charts available, when best to use them, and the type of data you’ll need for each chart option. We also highlight the different ways to manage and use your charts after they’ve been created.

You can display your data in a variety of ways within Chartio with our flexible chart creation.

- Use our powerful editor to query your data sources. Choose between Visual or SQL Mode.
- Leverage our Pipeline to transform your data into results.
- Build the right visualization to highlight your results and fine-tune your chart with flexible customization settings.
- A collection of charts can be organized on an interactive dashboard, which can then be shared with your team.
Visualize your data
Bring your data together and build the right visualizations to identify trends, patterns, and outliers.
Preview a chart type
Whether in Visual or SQL Mode, preselect your chart type and easily toggle between different options to preview your visualization as you create.
Chart library
Start with a chart type from the chart library and customize it to fit your needs or apply a custom theme to your entire dashboard for coherency.
Interactive legends
Toggle the visibility of a series in a chart by clicking the series name in the chart legend.
Chart data limits
Chartio queries all rows in your data source when performing calculations. However, for performance reasons, we only return up to a certain number of rows for your final result set, which depends on the selected chart type.
Maximum row limit
- 100,000 rows for Table charts and Box Plots
- 20,000 rows for Bubble Map charts
- 10,000 rows for all other chart types
To allow for more rows past the 100k row limit, you can utilize a Data Store in Chartio. The row limit for Data Store tables is 1 million rows. The Data Stores will not allow you to add more rows to a chart but will help perform aggregations on larger data sets before bringing the data into your charts. Since Chartio is a tool for building dashboards, its primary use case is meant to use aggregated data to view trends.
Note: We now offer increased query and Data Store row limits for Organization plans. If you’re interested in upgrading, please contact support@chartio.com.
Maximum size limit
- 20MB per chart (total size of query result data)
To work around the 20MB size limit and reduce the size of your chart, you can reduce the amount of data returned from your query by setting a row limit, filtering the data, or selecting fewer columns. Another option is to split the chart into two with each with different filters so you still have the data in its entirety but in two different charts.
Real-time data
If you connect your data source to Chartio, Chartio queries that data source directly to return the results; therefore, your charts’ results reflect real-time data as soon as the charts are set to update.
If you’d like to reduce the load on your data source and/or don’t need real-time data, you might find changing the Cache Duration and using Data Stores to be useful.