Add country names to your Maps
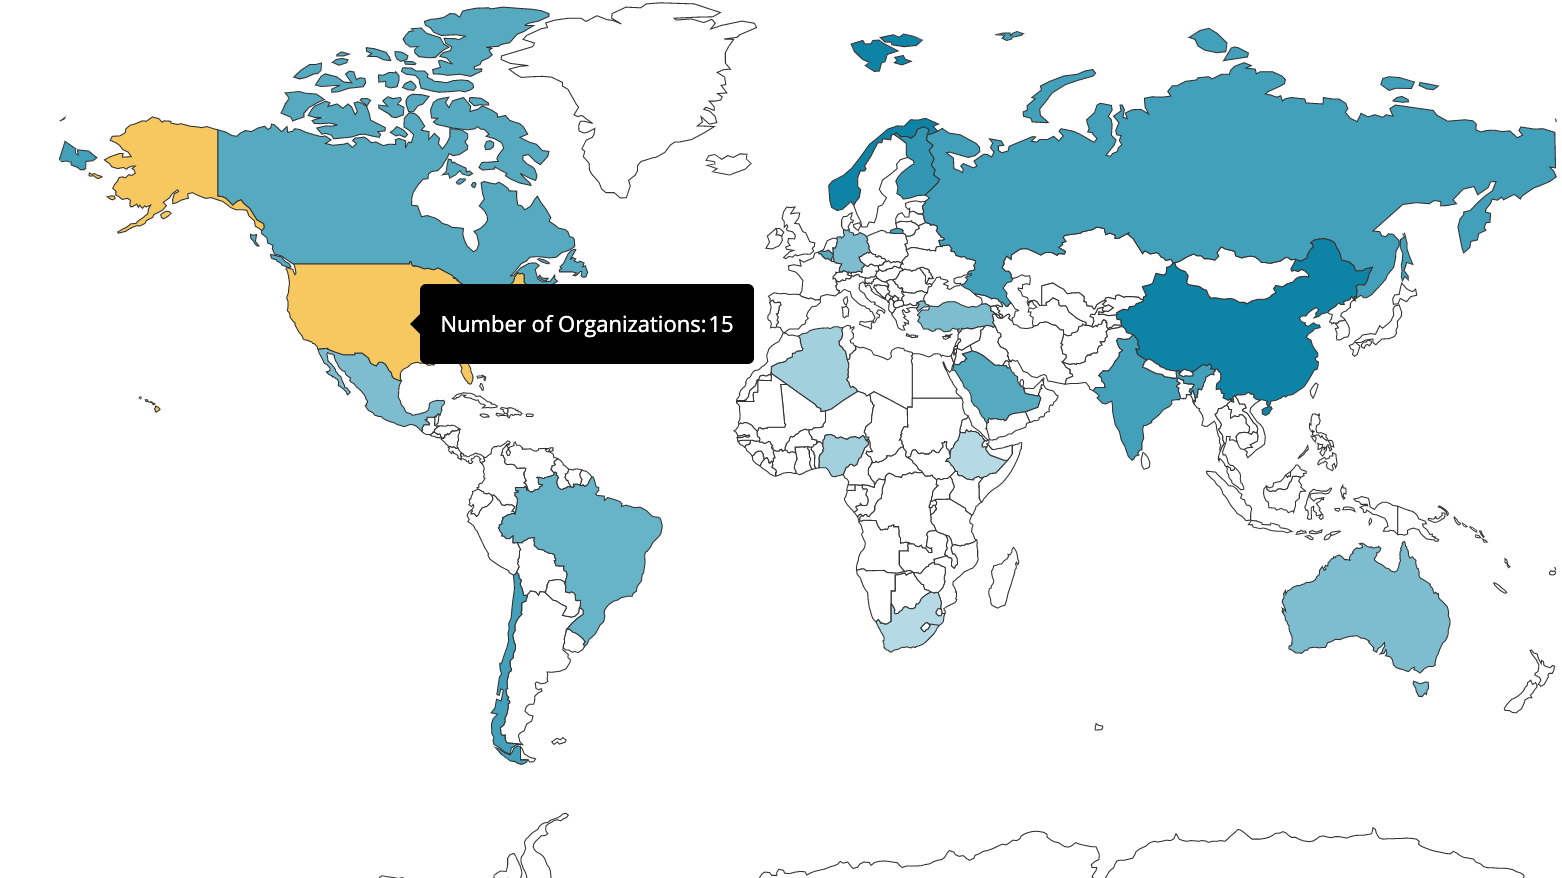
If you’re looking to view full country names in your Map charts when you hover over a country, you’ll need to standardize the naming in your country column to only use full country names. If your column includes different naming conventions (e.g., a mix of abbreviations and full names), we won’t be able to recognize which one to use.

If this country naming convention isn’t possible to uphold on your database directly, two options are possible in Chartio:
Option 1 - Custom column
If you’d like this option in numerous charts, you can create a custom column with a CASE statement changing all the country codes or abbreviations to full country names. The syntax of your CASE statement depends on the syntax for your underlying data source type. You would then use this custom column in your Visual Mode queries when you’re creating Map charts.
Option 2 - Edit in the Pipeline
Edit your country column in the Pipeline by using the Apply Formula Action (Visual SQL) or Edit Column (Data Explorer) Step, selecting Custom Formula as the formula type, then creating a CASE statement to change the country codes to full country names using SQLite syntax as shown in the example below. To fit this to your needs, simply replace Country with your column’s name.
case when "Country" = 'AU' then 'Australia'
when "Country" = 'CA' then 'Canada'
when "Country" = 'US' then 'United States'
else "Country"
end
Note: This CASE statement needs to include all countries within your column for the country name labels to be applied to your chart. If some country names include abbreviations or typos, they won’t be recognized on your Map.
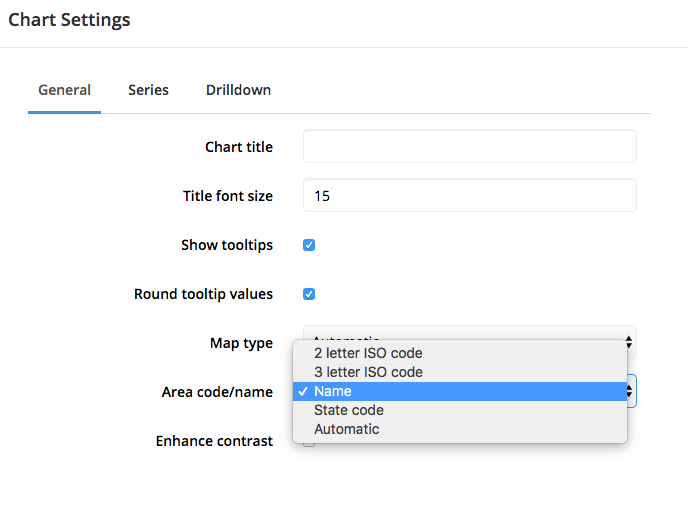
Once your CASE statement is completed, make sure to update your chart settings to recognize your new column format. Upon opening the chart settings, navigate to the General tab, select Name for the Area code/name. Click Done once completed.

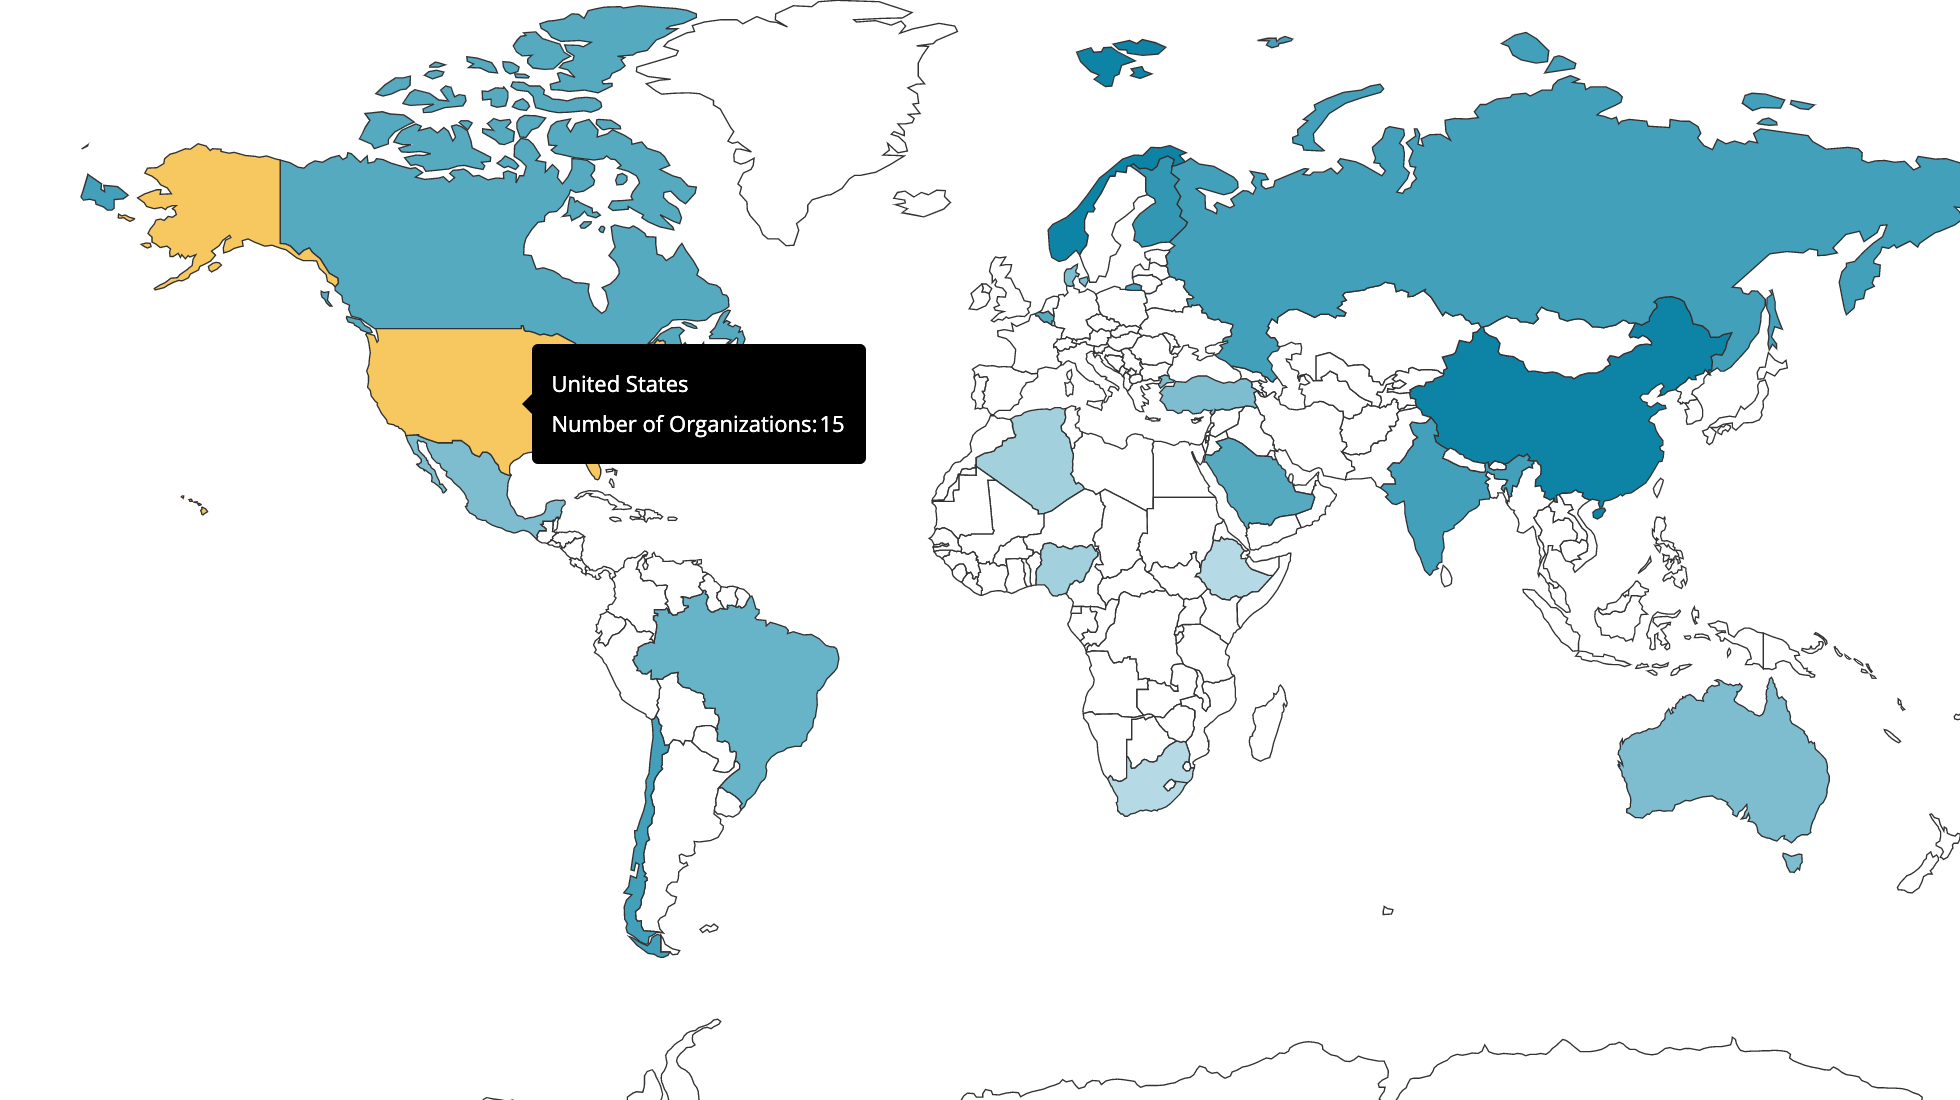
Your final chart will now show both the name of the country you’re hovering over and its corresponding aggregated value in the tooltip.
