Explore Chart Data feature
The Explore Chart Data feature allows your dashboard Viewers with data source access to view the chart in the chart editor. Viewers can save a copy of the chart to a dashboard where they have Editor or Admin access but they cannot alter the original chart. This is incredibly useful for allowing users to learn how specific charts were created, while protecting the charts from accidental edits.
The Explore Chart Data option is only available on charts where the user meets all of the following criteria:
- User has Viewer access to the dashboard;
- User has Editor or Admin access to all of the data sources used in the chart
For example, let’s say a you have Viewer access to the Executive Summary dashboard where the Pipeline Overview chart is located. You also have Editor access to the “Document Company Demo Data” data source, which was used to make the chart. For any chart on the Executive Summary dashboard that only uses the “Document Company Demo Data” data source, you can see Explore Chart Data when opening the chart’s ellipsis menu.
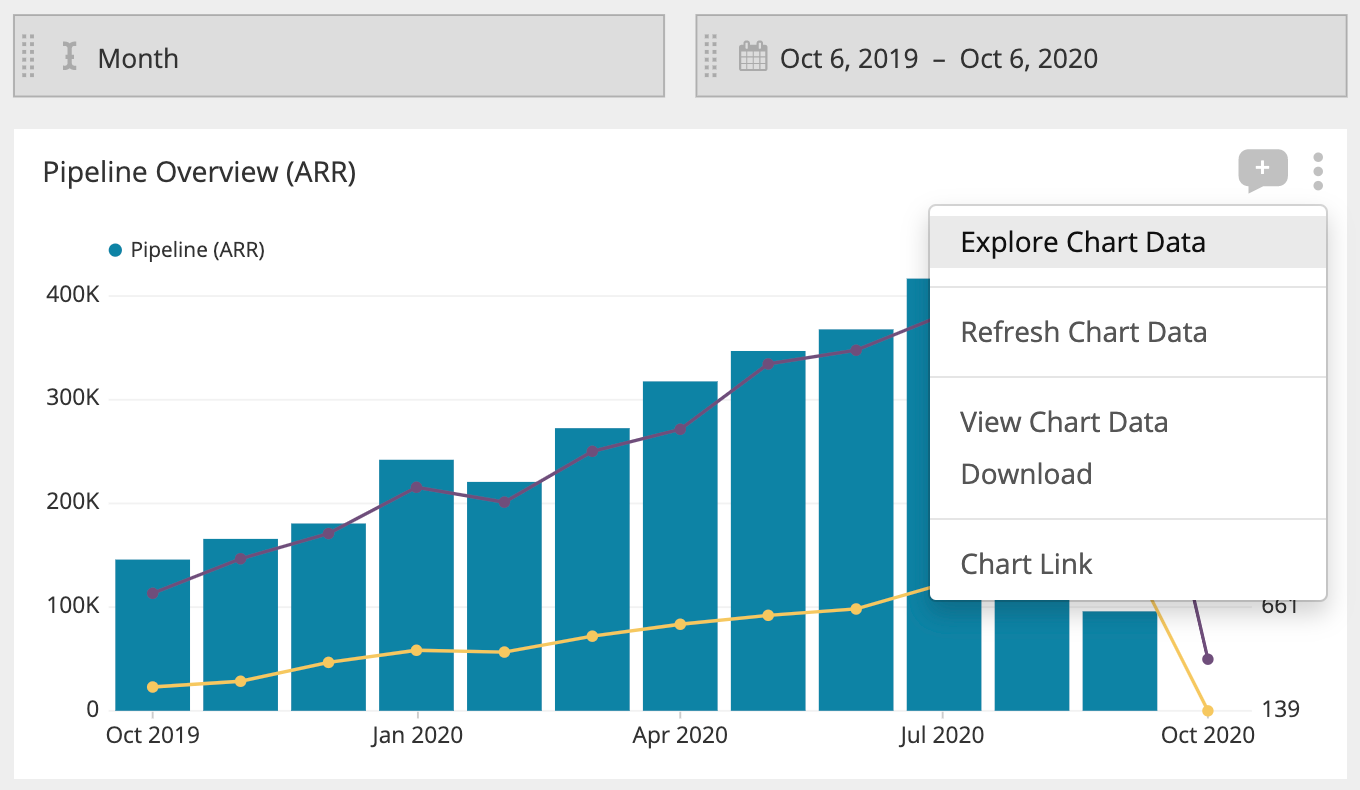
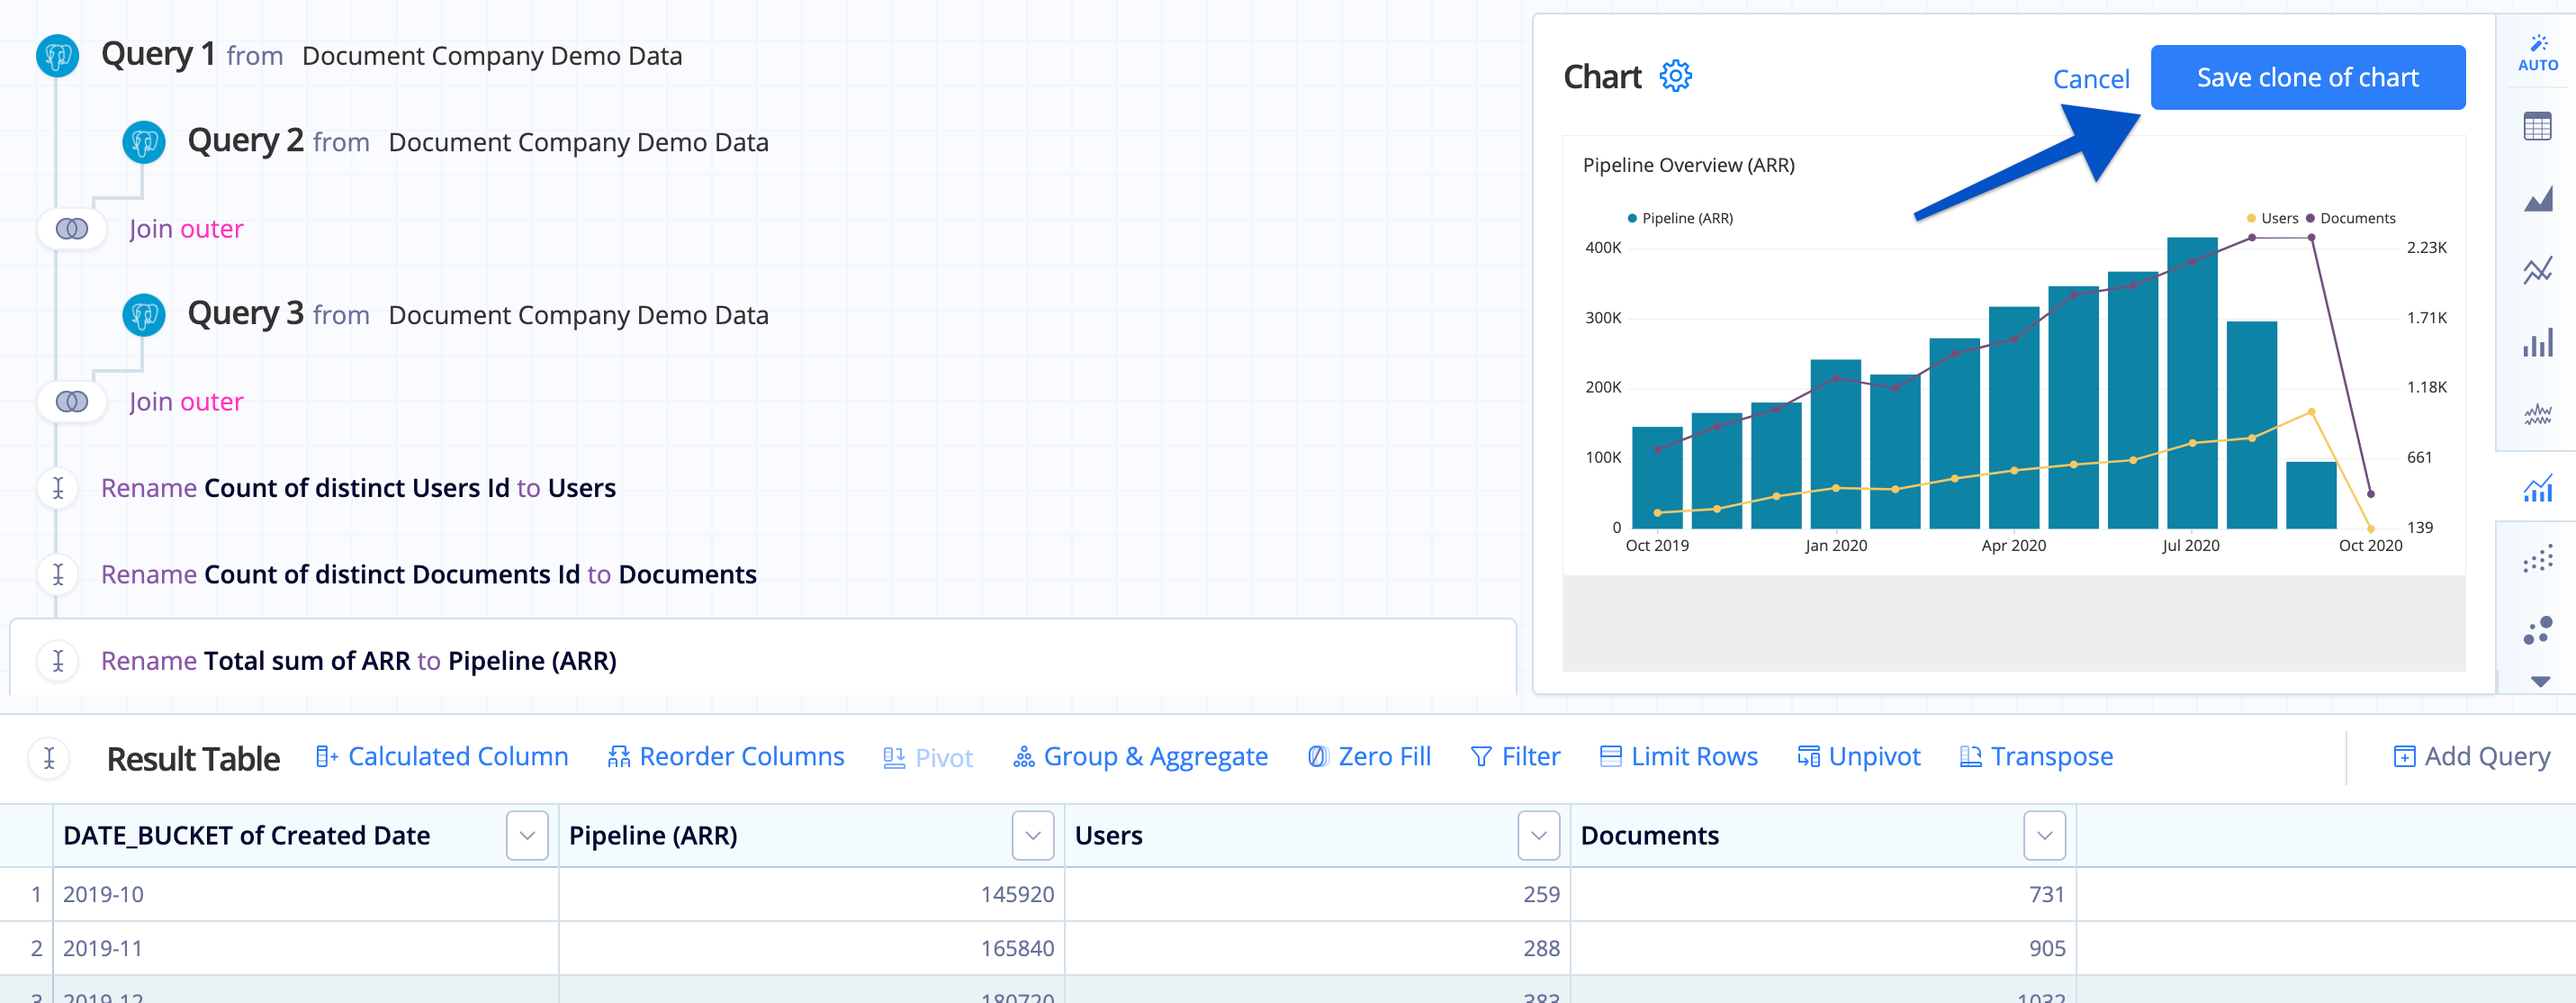
When you click this option, you’re taken to the chart editor. You won’t be able to permanently alter the original chart, but you can explore the chart’s queries and settings. For example, you can make adjustments to the chart, run the queries, and see the updated chart preview. If you want to keep the changes or further edit the chart, you can click on Save clone of chart (Visual SQL) or Save copy to… (Data Explorer) in the top-right corner of the chart editor to save a clone of the chart.
| In the Visual SQL interface |
|---|
 |
| In the Data Explorer interface |
|---|
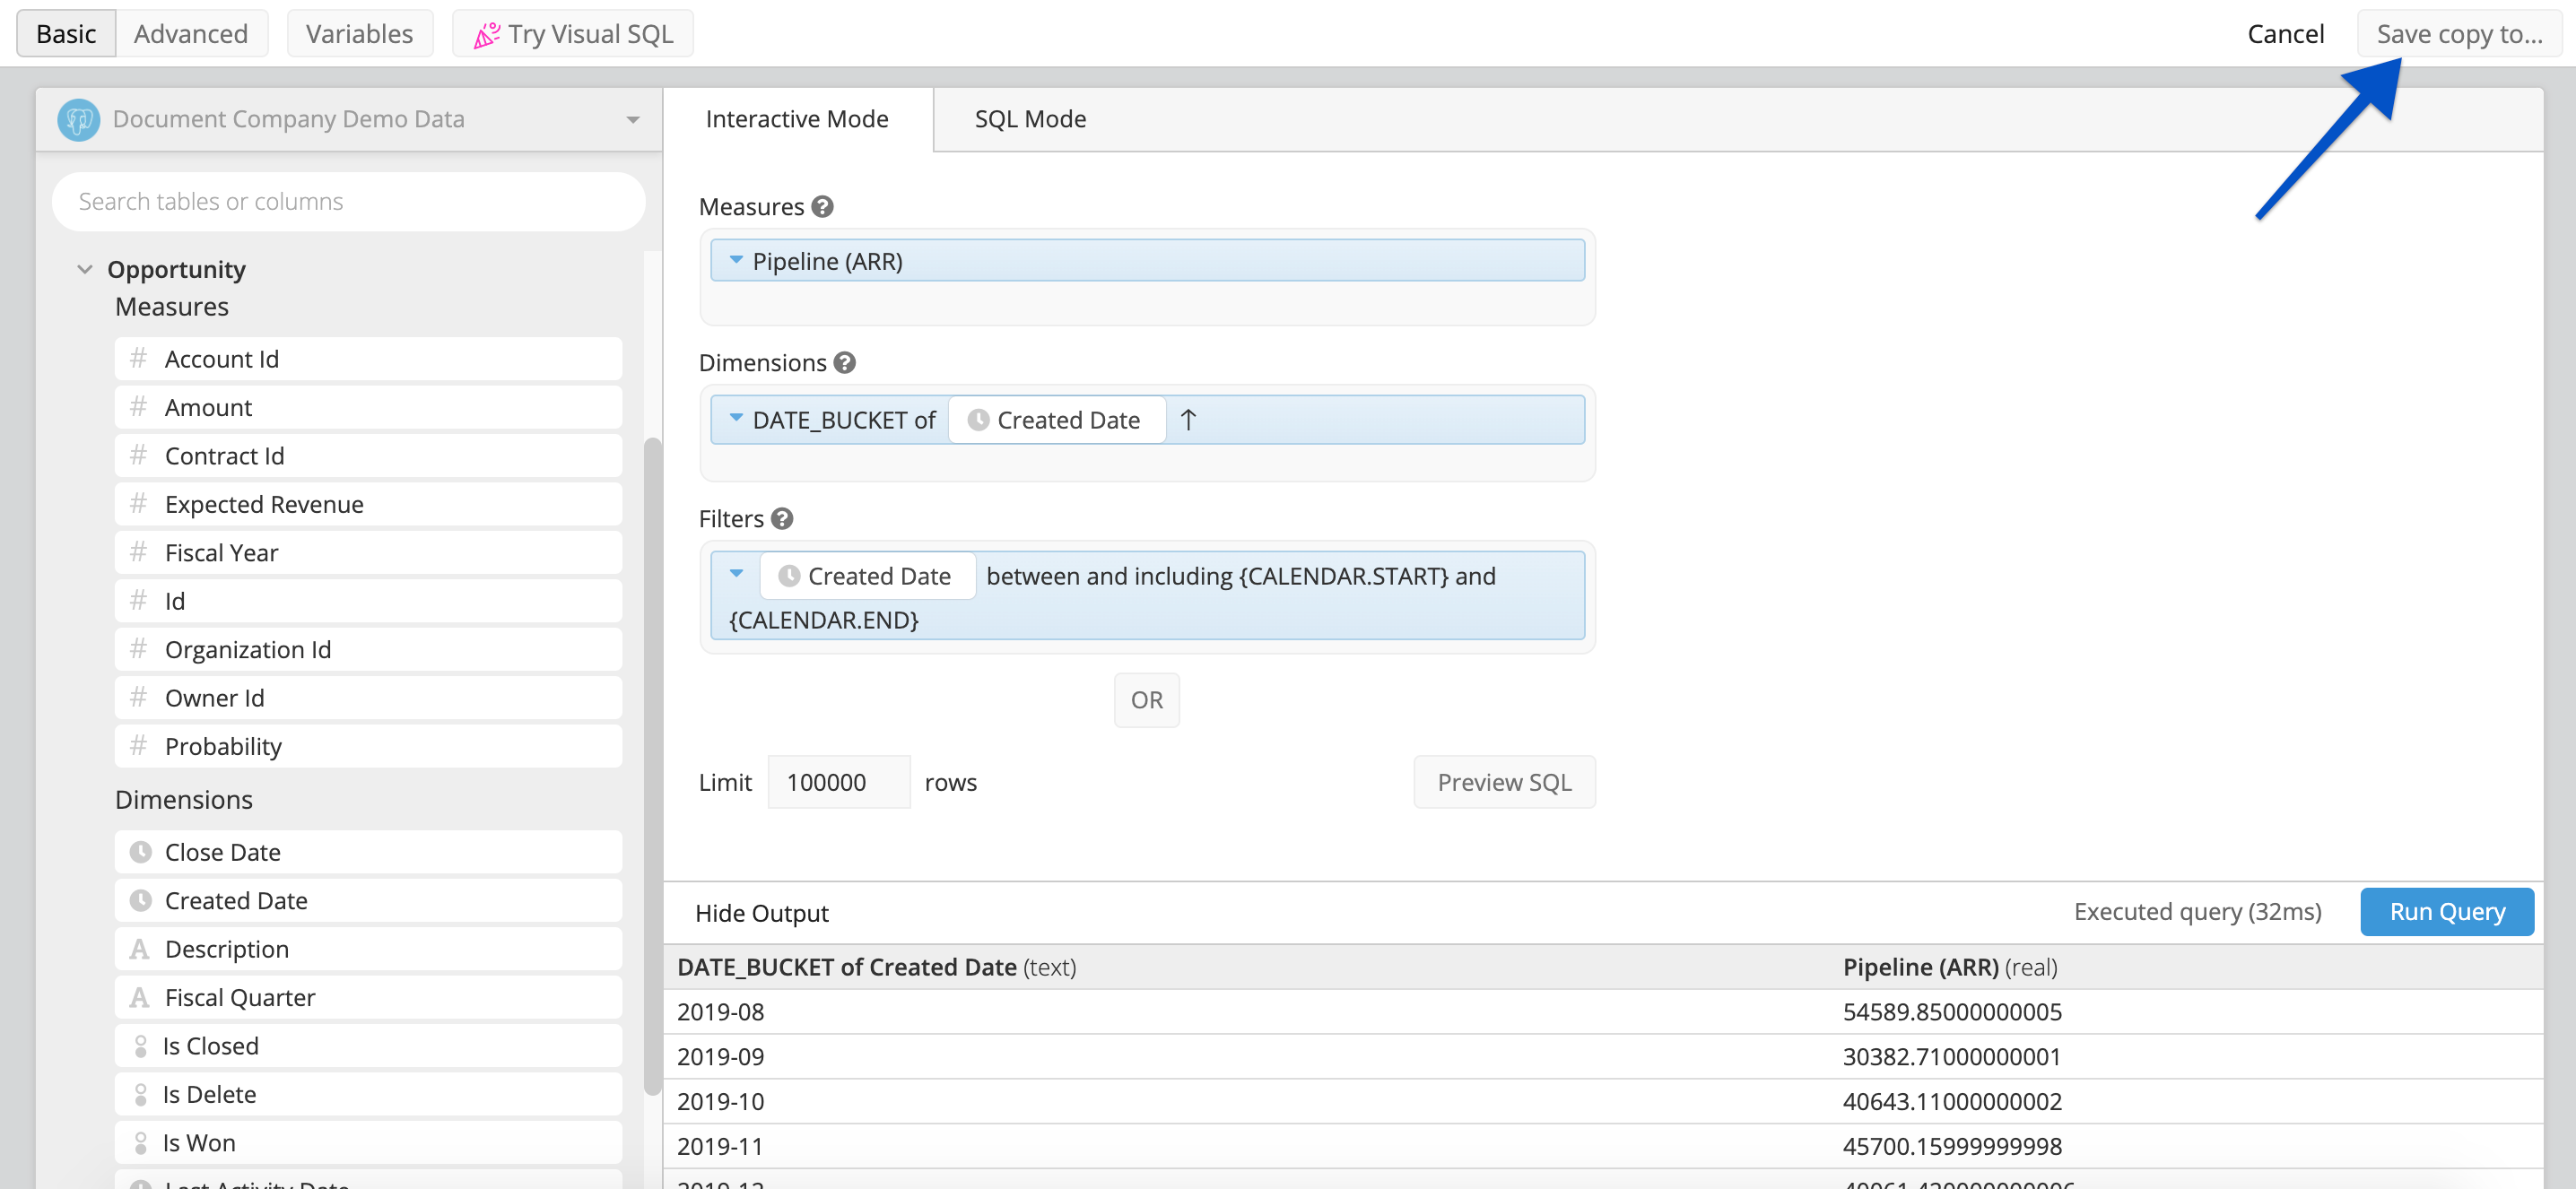 |
After clicking on “Save copy to…”, a pop-up appears where you can choose which dashboard (to which you have Editor or Admin access) you’d like to save the chart to. Select the dashboard and click Save.
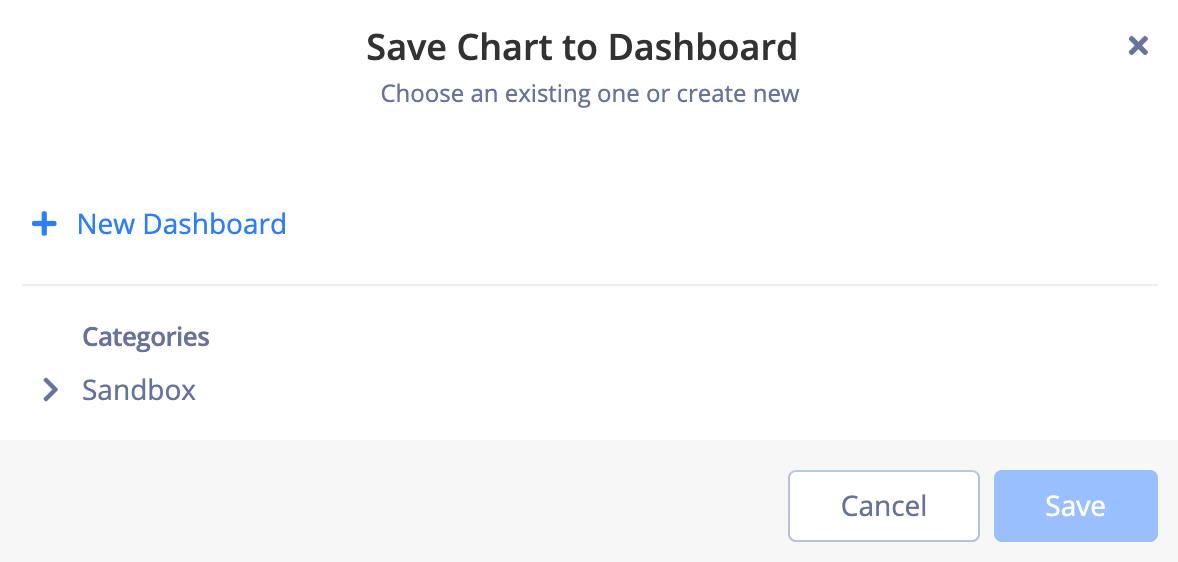
If you don’t have Editor or Admin access to any existing dashboards or you’d like to save the chart to a new dashboard, click on the +New Dashboard option in the dashboard pop-up. You’re prompted to name your new dashboard and provide the Category in which it should be located. Once this information is filled out, click Save.
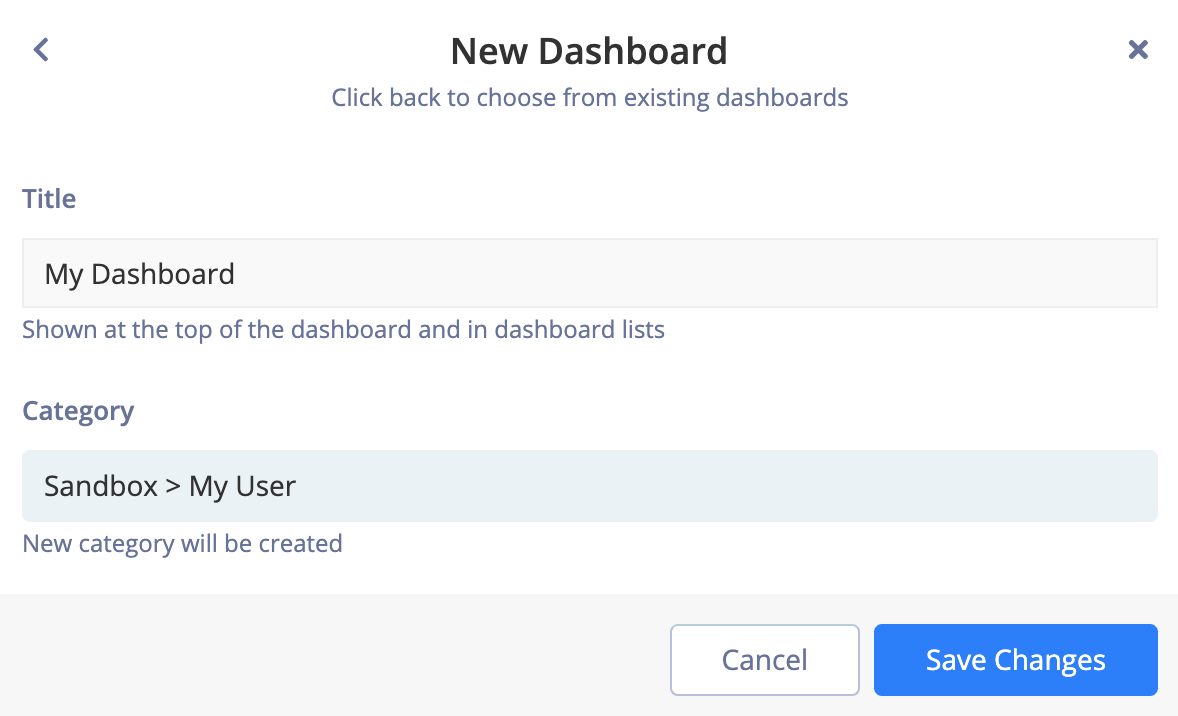
You’re then taken to your selected dashboard to place the cloned chart where you’d like.