Connect to Google Sheets
Chartio’s Google Sheets connection allows you to automatically import Google Sheets to your account and use them like you would any other data source. A spreadsheet corresponds to a database, and worksheets correspond to tables. Any updates made to rows in your Sheets data are immediately queryable in Chartio.
Check out our step-by-step video showing how to upload your Google Sheets as a new data source and start building chart with it in Chartio:
1. Preparing your Google Sheet
Formatting requirements:
- Remove extra headers and footers.
- Each worksheet should be in a tabular format, starting in the top-left cell, with all data arranged in columns and one header row with no empty header cells.
- The header row should contain no special characters (including newlines). Headers should contain only numbers, letters, and/or underscores.
- Use the Google Sheets Format menu to correctly specify the format of a column.
- Change the decimal separator. If your Google Sheet uses a comma (
,) for the decimal separator, data may not accurately be brought into Chartio. The issue is Chartio expects the decimal separator to be a period (.). By opening your Google Sheet and changing the locale of your spreadsheet (File > Spreadsheet settings) to United States, for example, it will change the decimal separator to a period. This allows Chartio to detect the column as the correct percentage value.
2. Connecting a Google Sheet
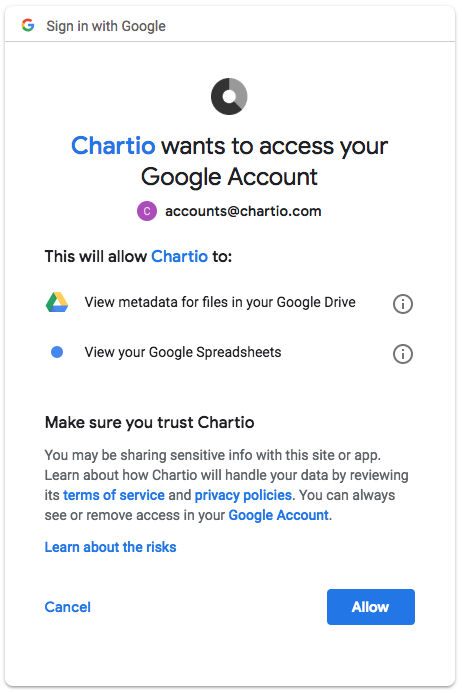
If you’re already signed into the Google account you want to associate Chartio with, you’ll be prompted with a simple permissions request to allow access. If you’re not, you’ll need to sign in to your Google account before access is allowed.
Connecting your Google Sheet as a data source in Chartio is a straightforward process. Here are the steps to follow:
- Click Data > Add Data Source > Google Sheets.
- Choose your Google account.
-
Click Allow.

- Select the spreadsheet you want to connect.
-
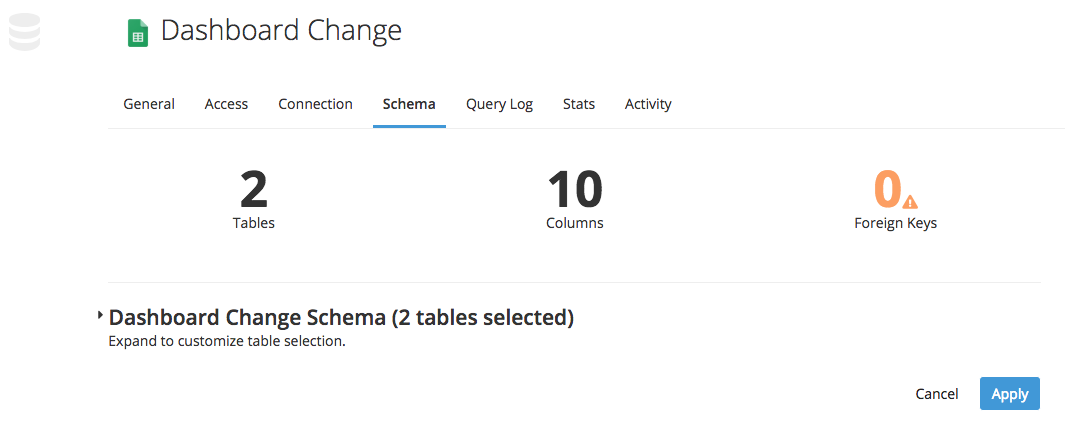
Select the tables and columns you want reflected in your schema and click Apply.

Now you have your Google Sheets data in Chartio for you to analyze, merge with your database data, and visualize on your dashboards.
If you run into any trouble during the setup process, feel free to contact us at support@chartio.com.
Adding notes to your tables using Google Sheets
The Google Sheets integration allows you to add notes and supplementary data to your existing Chartio charts and tables. Adding a Google Sheet as a data source and entering the note in a column in the Sheet allows the note to appear in a table in Chartio.
- Create a Google Sheet with your notes and add a foreign key to join the notes to your existing table.
- Add your Google Sheet as a data source to your Chartio account.
- Any changes or notes added later in additional rows are automatically picked up and displayed in your table. For any additional tables or columns in your Google Sheet, you’ll need to refresh the data source schema.
Tip! In order to make it easier to access that Google Sheet in the future, add a Link to the Google Sheet on your dashboard.
Google Sheets limitations
- Renaming the spreadsheet, a worksheet, or a column is currently not supported. Such updates are treated as a deletion and addition and will cause errors with any charts currently using a renamed object. Moving a column or worksheet is supported.
- The user who initially added the data source will need to remain an authorized user and maintain access to the spreadsheet. If you’d like to change the authorizing user or re-authorize, this can be done from the Connection tab within the specific Google Sheet’s settings.
- Any column named “Id” will be renamed to “Id1”. This is due to Google Sheets returning the row ID as “Id”, which shows as a hidden column in your schema.
Google Sheets SQL Mode syntax
- SQL syntax reference
- Strings must be wrapped in single quotes (e.g., ‘John Doe’).
- Use Oracle’s syntax for datetime formatting using the
FORMAT()function.- For example:
FORMAT("Table"."Column", 'MM-dd-YYYY')
- For example:
Because of the JDBC driver we use to connect Google Sheets to Chartio, there are certain SQL functions you can use in SQL Mode:
- Datetime functions
- String functions
- Math functions
- Joins - Only Inner and Left Joins are available to use in SQL Mode
Note: If you want to use different types of joins, you can use multiple Add Query Actions (Visual SQL) or datasets (Data Explorer) and join them in the Pipeline.
Date formatting in Google Sheets
For Chartio to recognize dates correctly in Google Sheets, use either of these date formats:
YYYY-MM-ddMM-dd-YYYY
This is because we automatically determine all dates to be in US format.
However, if you require your dates to be in a different format, we can update the date format pattern on a per-sheet basis from our end. Just send us a quick email at support@chartio.com—be sure to include the required date format pattern (e.g., dd/MM/yyyy) and which of your Google Sheets need the update.