Performance Triage
If you ever experience slow-loading dashboards and charts, we recommend investigating and taking action on these key areas:
I. Dashboard features
II. Data source stats
III. Scheduled jobs
IV. Organization default settings
Follow our performance decision tree to guide you through your performance optimization. We highly recommend going in the order we’ve set above.
Performance issues can seem daunting at first, so we also recommend bookmarking this page so you can easily reference it when needed.
When does Chartio send queries to my data source?
Before we get to the weeds of performance optimization in Chartio, it’s important to know when Chartio sends new queries to your data sources. Sending new queries requires using your data source’s resources, and if your data source receives too many queries at one time, some or many of those queries may timeout, leading to the performance issues you’re experiencing.
Here are the situations that trigger Chartio to send new queries to your data source:
- A dashboard is opened and the chart/dashboard cache is expired (for Smart refresh, the dashboard cache updates only when the dashboard is actively viewed)
- Charts are manually refreshed
- A dashboard’s Email Report (if the cache is expired or the data is older then 30 minutes), Snapshot (if the cache is expired), or Alert is being generated
- A Data Store query is being executed
- An ad-hoc query is run from Data Explorer or Visual SQL
- When a Dashboard Control is updated (or when Auto Apply Variables is deselected and “Apply Filters” is pressed).
- When the value of a Drilldown is changed
If none of the above criteria are met, then new queries are not sent to your data source.
I. Check the dashboard features

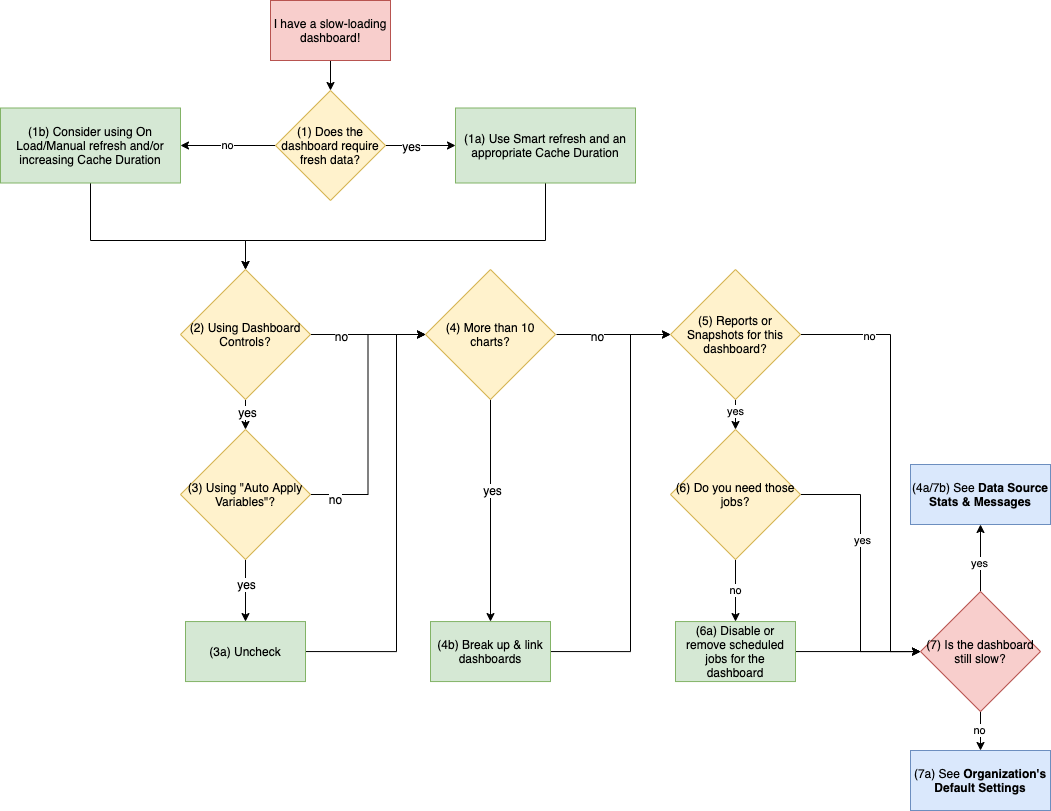
If there’s a specific dashboard giving you grief, we recommend checking its dashboard features as the first step in your performance optimization journey. Modifying these settings may help alleviate your performance issues.
- Does your dashboard require fresh data?
-
Yes, I need my data to be up-to-date often!
Update your refresh method to Smart and set an appropriate Cache Duration.
Continue to Step 2.
-
No, I can deal with stale data for a bit.
Consider using the On Load or Manual refresh method and/or increasing the Cache Duration.
Remember—if you ever need fresher data before the next Auto Refresh Interval, you can always override the Auto Refresh Interval by manually updating a dashboard or individual chart’s data.
We’ve got more optimization recommendations though, so keep reading!
-
- Does your dashboard have any Dashboard Controls?
- Check if Auto Apply Variables is selected in the dashboard settings.
-
It’s not. I’m ahead of the game.
Nice! Continue to Step 4.
-
It is. What should I do?
Deselect it.
If you have any Dashboard Controls on your dashboard, you can reduce the number of queries to a single query by deselecting Auto Apply Variables in the dashboard’s settings. Otherwise, a query is sent upon every Dashboard Control change, which could definitely impact your data source.
-
- Do you have more than 10 charts?
-
Nope, I’m a minimalist.
Not a lot of charts but your dashboard is slow? Interesting! Let’s continue to Step 5.
-
Yes, I’ve got a bunch of charts.
It’s best to have your most important charts at the top of the dashboard for quick and easy accessibility—we also prioritize loading those first. If you have any charts below the fold (i.e., you need to scroll down to see them), you should assess whether the charts are needed or if you can break the dashboard down then link them together. You can also check out our blog post for tips on keeping shorter dashboard.
This minimizes the number of queries a dashboard sends when refreshing, freeing up your data source resources. Overloading your data source leads to performance issues as your data source resources are taken up.
-
- Do you have any Email Reports or Snapshots for this dashboard?
- Are those Email Reports and/or Snapshots necessary?
-
No, I don’t really need them anymore.
As we mentioned in the beginning, new queries are sent to your data source when you have any of these scheduled jobs enabled for your dashboard. If you no longer need them, it’s best to remove them. If you don’t need them but don’t want to remove them in case you want to enable them again in the future, you can simply disable them:
-
Yes, I still need them.
No problem. We’ve got some best practices for using scheduled jobs, but we’ll get to those later. For now, just continue on to Step 7.
-
- After making the recommended changes we’ve discussed so far, is your dashboard still slow to load?
-
Yes! What do I do now?
Time to check your Data Source Stats.
-
No, my issues were resolved!
That’s awesome! We’ve still got some recommendations for you though, so please check your organization’s default settings.
-
II. Check your Data Source Stats

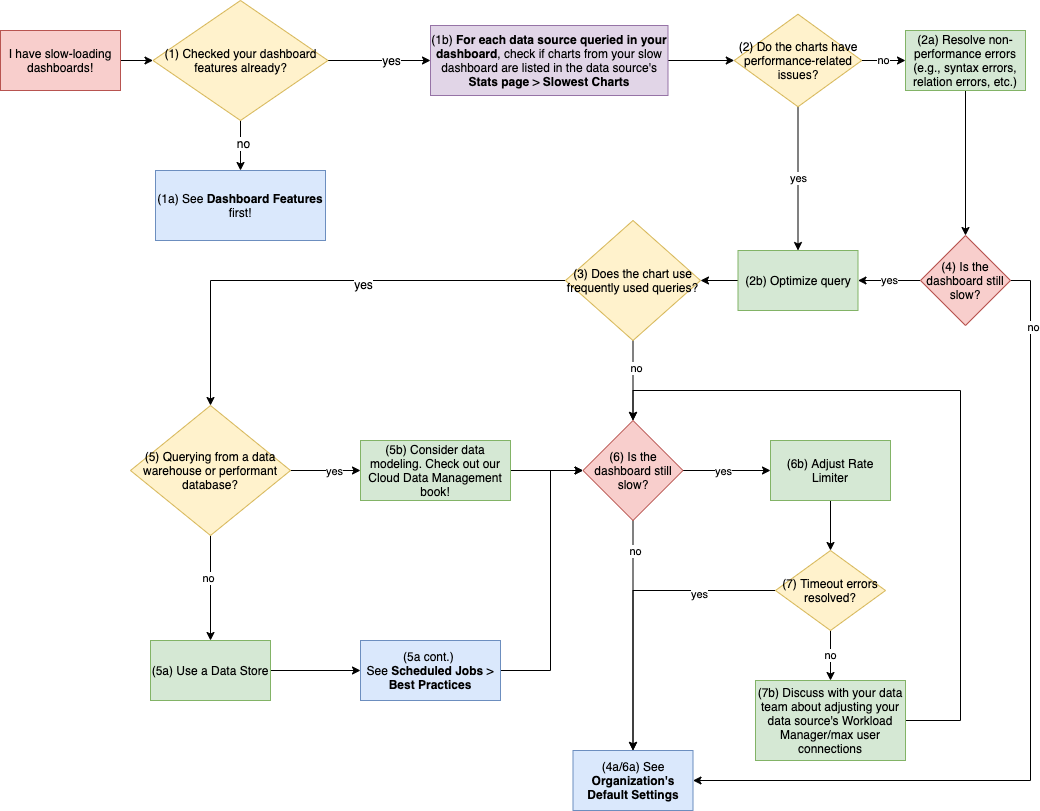
- Have you checked your dashboard features already?
-
No, I skipped it!
We highly recommend you check your dashboard features first.
-
Yes, yes, I’ve already checked them. What’s the next step?
Every data source has a Stats page that provides a breakdown of that data source’s performance. At the bottom of the Stats page is a Table chart titled Slowest Charts.
For every data source queried by your dashboard, check if charts from your slow dashboard are listed in that data source’s Slowest Charts.
-
- If a chart from your problematic dashboard is listed in Slowest Charts, check the chart’s performance logs. Does it have any performance-related errors (e.g., timeout errors) or long-running query durations?
-
I don’t see any performance-related issues.
Try to resolve the non-performance errors (e.g., syntax errors, relation errors, etc.). Once you’ve done that, skip to Step 4.
-
It does!
Try optimizing your queries for the chart. This can be tricky and require some creative thinking. One option is to consider moving some of the aggregations/manipulations outside of the Query—for Data Explorer, you’d use Steps; for Visual SQL, you’d use Actions. These transformations performed outside of the query are post-SQL manipulation, so new queries aren’t sent to the underlying data sources when you add more transformation steps, as long as the initial Query doesn’t change.
Check out how to Optimize your SQL Query from our Data School, found in our eBook SQL Optimization, which contains other tips and tricks for optimizing your SQL.
Once you’ve done that, move on to Step 3.
-
- Does the chart use any frequently used queries? (For charts listed in “Slowest Charts” but don’t have any timeout errors)
- After resolving your non-performance errors, is your dashboard still slow to load?
-
No, problems are solved and my dashboard is loading just fine!
That’s awesome! We’ve still got some recommendations for you though, so please check your organization’s default settings.
-
Yes, it’s still slow…
That’s a bummer… But don’t give up yet! Go back and try our recommendation for Step 2b.
-
- Is the query (or queries) pulling data from a data warehouse or performant database?
-
No, I don’t have my own data warehouse/performant database
You can create a Data Store as an intermediate step for data modeling. Creating a Data Store requires scheduled queries to be sent to refresh its stored data. Because of this, you need to check your scheduled jobs then continue to Step 6.
-
Yes, I’m using my own data warehouse/performant database.
You may need to consider modeling your data or creating materialized views, which you should talk to your data team about. It’s easy for us to say, but it may take a bit of time and effort to do.
Check out our Cloud Data Management book for great tips on how to model your data.
After data modeling, continue to Step 6.
-
- Is your dashboard still slow to load?
-
No, everything’s great now!
That’s awesome! We’ve still got some recommendations for you though, so please check your organization’s default settings.
-
Yes, do I have more options?!
We’ve got more ideas for how to solve this! At this point, we’d say you may benefit from adjusting the Rate Limiter for the data source; however, we recommend performing all other performance adjustments mentioned in this page (including checking your scheduled jobs) before considering this. Unfortunately, you can’t adjust the Rate Limiter yourself at this time, so please reach out to us at support@chartio.com and we can do it for you.
If you’re here after already doing Step 7, you may need to adjust the Rate Limiter again to match with your updated workload manager/maximum user connections.
After adjusting the Rate Limiter, continue to Step 7.
-
- Are the timeout errors for your charts resolved?
-
Yes, I don’t see any more timeout errors.
That’s awesome! We’ve still got some recommendations for you though, so please check your organization’s default settings.
-
No, adjusting the Rate Limiter didn’t help.
We recommend discussing with your data or engineering team about adjusting your data source’s Workload Manager or maximum user connections. After adjusting the data source settings on your end, go back to Step 6.
-
III. Check your scheduled jobs

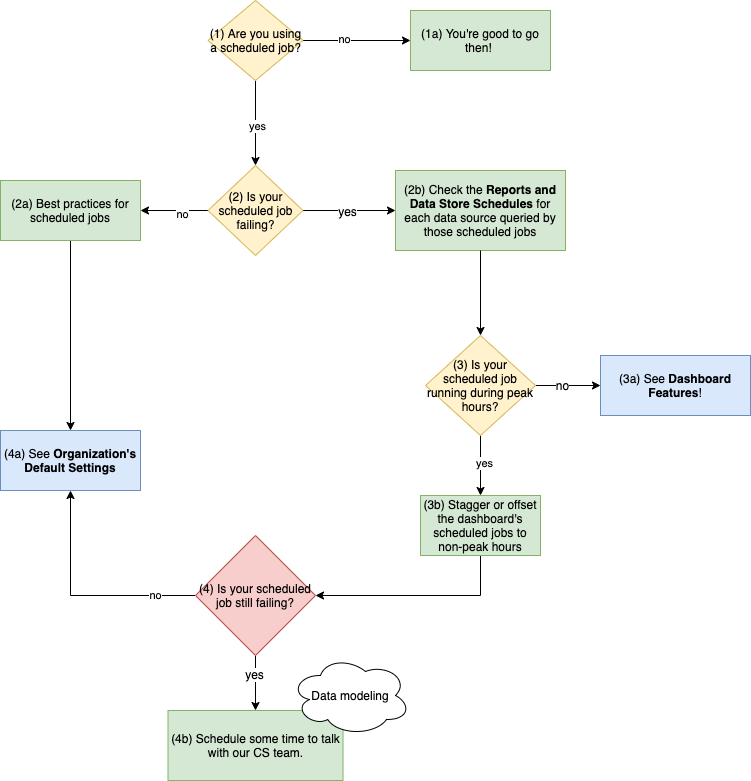
What exactly are scheduled jobs? Good question! Scheduled jobs are Chartio features (i.e., Data Stores, Email Reports, Alerts, and Snapshots) that send new queries to your data source. Each of these Chartio features has schedule settings, which you set to tell Chartio when to trigger them. If you have all your scheduled jobs triggering at the same time, this could overwhelm your data source, resulting in potential timeout errors.
- Are you using a scheduled job?
-
Nope!
You’re good to go then! You don’t need this triage.
-
Yes.
Continue to Step 2.
-
- Is your scheduled job failing?
-
No.
Cool! Let’s go over some best practices for scheduled jobs so you don’t run into performance issues later on.
If you have any scheduled jobs, try to:
- Stagger them—so they don’t send queries at the same time
- Offset them to non-peak hours—so they don’t send queries during high traffic times like during business hours
Doing the above will help to ensure your data source has enough resources available when your scheduled jobs are triggered. In other words, your scheduled jobs will most likely not fail.
See our answer for Step 4a.
-
Yes!
For each data source queried by your scheduled job, go to the data source’s Stats page and look at the Heat Map titled Reports and Data Store Schedules then continue to Step 3.
-
- Is your scheduled job triggered during peak hours?
-
No, but it’s still failing.
That’s not good… If you haven’t already, check your dashboard features.
-
Yes, is that bad?
If you’re triggering a scheduled job during peak hours, it’s competing with other potentially scheduled jobs in addition to the other reasons why Chartio triggers queries, which could explain why your scheduled job is failing.
If you have any scheduled jobs, try to:
- Stagger them—so they don’t send queries at the same time
- Offset them to non-peak hours—so they don’t send queries during high traffic times like during business hours
Doing the above will help to ensure your data source has enough resources available when your scheduled jobs are triggered. In other words, your scheduled jobs will most likely not fail.
After doing this, continue to Step 4.
-
- Is your scheduled job still failing?
-
No, all good!
Perfect! To prevent future dashboards from impacting your data sources, please check your organization’s default settings.
-
Yes…
After checking your dashboard features and data source stats, your scheduled job is still failing? Hm… how about scheduling some time with your Data Advisor (for Organization plans) or the Customer Success team to discuss this further.
-
IV. Check your organization’s default settings

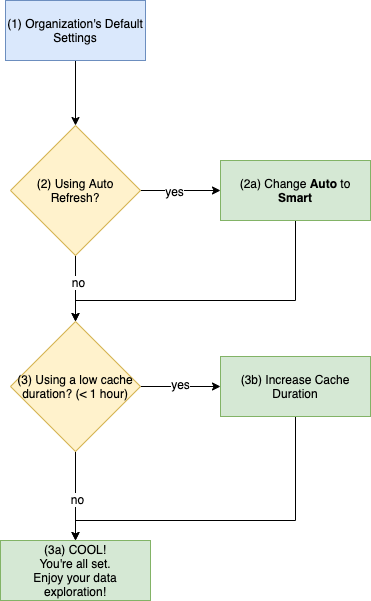
- If you’re an Owner, you can take some preemptive actions by changing your organization’s default settings. Changing these settings won’t affect existing dashboards, but they will affect new ones.
- Is the refresh method set to Auto?
-
No, it’s not.
Cool, continue to Step 3!
-
Yes, Auto refresh all day, every day.
Change it to Smart refresh. Smart refresh is almost the same as Auto refresh, but it will only update the dashboard if it’s currently viewed in an active browser tab. No point updating a dashboard if you’re not looking at it, right? Once you’ve done that, continue to Step 3.
-
- Is the cache duration low (e.g., one hour or less)?
-
No, we don’t update our cache that often.
Cool! You’re all set! Enjoy your data exploration!
-
Yes, what does it mean?
Consider increasing the cache duration. Lower cache durations mean new queries are sent to your data source more frequently. If you don’t expect your data to change often, it’d be a good idea to increase the cache duration to a more reasonable time. Plus, you can always lower the cache duration for individual dashboards, if needed.
-
As we mentioned earlier, updating your organization settings won’t affect your existing dashboards, so you still need to update the cache duration and refresh method for any existing dashboards experiencing slow performance.
We hope this guide helped you resolve your performance issues. If you have any questions or are still experiencing performance issues, feel free to reach out to us at support@chartio.com.