Metrics are an invaluable tool to understand product performance and where to focus a product manager’s energy and resources. But there are so many possible metrics, it’s important to focus on the right ones. This tutorial will walk through how to select useful and actionable product metrics for an e-commerce business.
Why Have Metrics?
There are many reasons why companies track metrics:
- They help focus and align an organization
- Metrics aid in making informed decisions
- Metrics, and setting goals against those metrics, drive accountability
- “What gets measured gets managed” - common management adage that asserts that tracking metrics results in improving those metrics
Specifically for Product Managers, metrics:
- Give focus on what is important for success
- Provide information on what types of improvements to make and on what part of the product experience
What Metrics Should a Product Manager Track?
Unfortunately there isn’t a single set of metrics that will work for all situations. But they fall into one of three categories: primary metrics, secondary metrics and operational metrics.
Primary Metric(s)
A primary metric is a metric that reflects the ultimate goal of the product, and should align with the ultimate business goal. It also should be a metric that is directly actionable by the product manager. It should have a well defined goal and a product’s performance (and, thus, a product manager’s performance) should be measured against it.
For example, for a typical e-commerce site, the topline business goal is often total revenue. So should total revenue also be the primary metric for a product manager? Probably not since revenue is very dependent on how much traffic comes to the site, which is typically outside a Product Manager’s influence. However, conversion rate (percent of visitors who make a purchase) is a great primary metric for this product manager since its very closely aligned with revenue and is the outcome of what is directly owned by the product manager - getting users on the site to make a purchase.
Another possible primary metric is revenue per visitor. This should be highly correlated with conversion rate since a purchase makes money, but it also touches on how much money each user spent. Generally, an e-commerce site can sell a variety of products and at different price points, so knowing the site has a conversion rate of 50% still does’t directly link to revenue. But the two metrics combined give a pretty full picture that aligns to the top business goal, and are both actionable by a product manager.
That raises the question, how many primary metrics should you have? In general, the fewer the better, since a main purpose of primary metrics is to focus on the most important contributor(s) to success. So the more metrics you have, the less focus there is. For this reason, you should limit yourself to as few metrics as possible, ideally one or two.
Another key feature of a primary metric is that it should be measurable without much lag. You want to know day to day (sometimes even hour to hour) how your product is performing against the primary metric, so you shouldn’t select a metric that requires a lot of time to pass to get a measurement. For example, customer lifetime value (LTV) is not a good primary metric because it can’t be measured without waiting a significant amount of time to know the outcome.
To figure out the best primary metric(s), spend time really thinking about what your function can control that can be measured without much lag and that most directly impacts the topline business objective.
Secondary Metrics
Secondary metrics are metrics that speak to long term business success and sustainability, but aren’t actively managed unless there’s a concerning trend. Secondary metrics are sometimes referred to as health metrics since they visualize the long term health of the business.
For example, most e-commerce companies realize that they can’t be successful in the long term if their customers are dissatisfied, even if they’re on a good short-term revenue trajectory. As long as customer satisfaction is in some acceptable range, the company isn’t trying to actively move the metric. But it’s a great secondary metric because the company wants to make sure that changes it’s making to drive the primary metric don’t negatively affect customer satisfaction beyond the acceptable range.
A product manager should have several secondary metrics - as many as define the long term outlook of the business and that are within the product manager’s realm. It’s key to define up front what ranges are acceptable for the secondary metrics and, as long as the metrics are healthy, to not spend energy on trying to move the needle on them. If a secondary metric is not in a healthy range, at that point the business needs to determine whether it should compete for focus and resources with the primary metric to get it to a better spot.
Some common secondary product management metrics in e-commerce are:
- Number of key actions per session / engagement rate: are users interacting with the available features?
- Customer satisfaction: how happy are customers with the product?
- Number of bugs: is the site working as intended?
- Bounce rate: are the landing pages relevant to the traffic coming in?
- Site speed: does the site load fast enough for its users?
- Active users: how many users come to the site?
- Number of sessions per user / user retention: do users come back to the site?
- Customer lifetime value (LTV, usually measured by cohorts): are the newer users converted worth as much in the long term as previous sets of users?
Note that a specific secondary metric could be the leverage to drive improvements in a primary metric. For example, a Product Manager may actively be trying to drive engagement of a particular feature in order to improve conversion rate. The point is that the Product Manager isn’t trying to move engagement rate for its own sake - only because it contributes to the primary metric. The product’s ultimate success is measured by whether that engagement rate increase impacted the primary metric, not by the engagement rate increase itself.
Operational Metrics
The operational metrics are where most of the actionable insights are for a Product Manager. These are metrics that help a Product Manager understand, as specifically as possible, where the opportunity is to drive the primary metric.
Common Operational Metrics:
- Feature engagement rate by feature: which features are more and least used?
- What feature (or set of features) are most / least used by users that convert?
- Drop off rates by feature or page: where are customers dropping off in the conversion funnel?
- What are the biggest sources of complaints to the customer service department and in customer surveys?
Also as operational metrics, a Product Manager should include cuts of operational metrics, secondary metrics and primary metrics by different actionable dimensions. For example, if the primary metric is conversion rate, we can cut that by geography and see whether there is a specific geographic area that is underperforming that should be corrected or one that is overperforming that we can learn from to try to replicate its success. Common cuts of data:
- geographic location
- device type - desktop, app, mobile web
- customer segment - whether a user is new to the site, a high value customer, a rarely seen customer, etc…
- traffic source - whether a user came to the site from Google search, email, ad, etc…
- landing page - what was the first point of entry to the site
A good set of operational metrics helps the Product Manager see what areas have the most opportunity and which will most likely contribute to the success of the primary metric. They don’t necessarily explain how to make the improvement, but they do point to what needs to be improve.
How to Use Operational Metrics
It’s easier to see how to use operational metrics with an example.
Alejandra, a Product Manager for an e-commerce company with a topline revenue goal, has conversion rate as her primary metric. She knows that a certain feature is essential to conversion and its performance has been steady over time. She starts drilling into cuts of this metric to look for opportunities. When she cuts the feature’s performance by geographic location she sees that engagement is much higher in English-speaking markets than in the rest of the world, which together make up 40% of traffic. This seems like a lot of opportunity since there is a large population that is underperforming on a feature that is closely tied with the primary metric. Alejandra can then investigate further to understand why non-English markets are underperforming (by walking through that particular product experience, talking to customers, etc…) and may uncover that poor translations are to blame for the poor performance and she can tackle that specific problem. The operational metrics helped her narrow down to a very detailed experience to make it easier for her to find the root cause of a problem.
How Many Operational Metrics to Have
There is no right number of operational metrics. In reality, you will end up with lots of operational metrics, maybe hundreds by the time to add in the cuts of all the metrics. So it’s important to know which cuts are most relevant to your business and which your product can address.
You’ll need to spend time digging through different cuts of your metrics, evaluating how useful and impactful they are, to know which are the ones worth keeping. When looking at cuts of your metrics, make sure you keep perspective on what will ultimately drive your overall goal. You’ll find that only a subset of your metrics and cuts are actually worth investing your time into.
Order your metrics in a dashboard with the most impactful and actionable ones first and limit your cuts of data to the dimensions that are actionable and large enough to be impactful.
How to Create an E-Commerce Dashboard
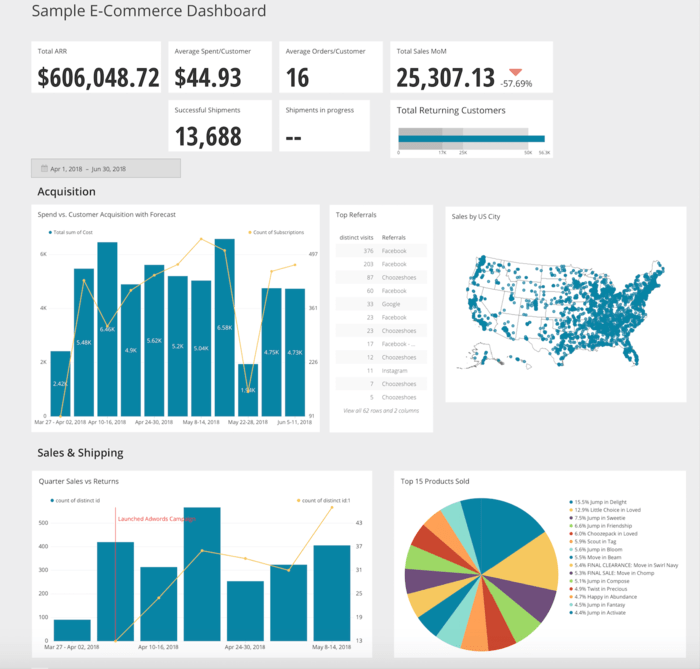
Like any other dashboard, an e-commerce dashboard communicates performance, efficiency and current growth of your online business.
Metrics like website traffic, revenue by product category, shopping cart abandonment rate form a part of the e-commerce business dashboard.
E-commerce businesses handle large amounts of traffic and data that is constantly being generated. A dashboard is your command center and a central place to see all that data that is being generated. The easy-to-understand format will assist you in making quick business decisions.
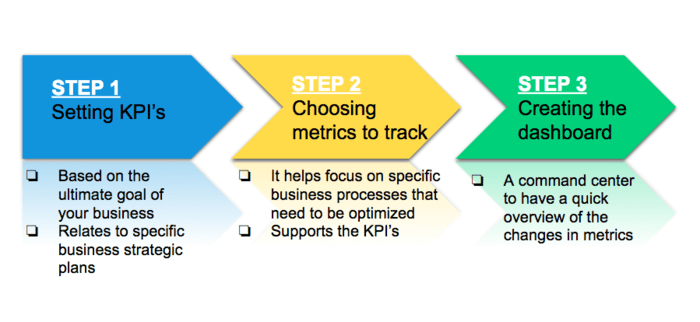
Before we look at how to create the dashboard, the first step is setting KPIs (Key Performance Indicators) and the second step is choosing the right metrics to track.

Step 1 - Setting the KPIs
A Key Performance Indicator is a quantifiable measure that indicates whether the business is set to achieve its targets. They are built on the strategic plans and goals of the business. An e-commerce business has large amounts of data to analyze and understand. Optimizing this data depends on the ultimate goals of the e-commerce business.
KPIs are the first step because they are a reflection of what the ultimate goals/strategic plans of the business are.
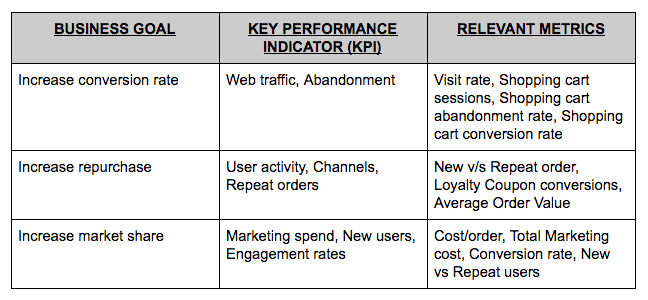
For example, if the business goal for this quarter is to increase conversion rates, the KPIs to focus on would be web traffic, abandonment rate, conversion rate.
Choosing metrics to track
KPIs and metrics can be easily confused with one another. While KPIs are set in the backdrop of business strategies, metrics are used as a specific measuring tool to track if the activities are meeting the KPIs.
Choose metrics that support the KPIs and ultimately trace back to the business goal. From the myriad choices of e-commerce business metrics, here are a few situation-based examples for choosing the correct metrics:

Creating a dashboard

The final stage is to create a dashboard.
To create a dashboard using Chartio, follow the simple steps:
- Connect your data sources to Chartio.
- From the homepage, click (+) New Dashboard button to create a new dashboard on Chartio.
- A dialogue box will appear and direct you to name your new dashboard.
- Click the Add Chart button on the right to create your first chart.
- Use the Data Explorer to quickly start building charts without writing SQL queries and create individual charts for each metric on your dashboard.
- Continue building out your dashboard by using the appropriate chart type for each metric. Here is an example for chart types for particular metrics:
- You can save and share your dashboard with your organization via a scheduled report or shareable link.
- Your dashboard automatically updates, so be sure to display your e-commerce business dashboard on a monitor so you can take a quick glance whenever you need to!
Summary
There are different types of metrics that combine to give a product manager a powerful toolkit:
- Primary metric(s): one or two metrics that can be directly impacted by a Product Manager and that closely align with the primary business objective. A product manager’s goals should be set against the primary metric(s).
- Secondary metrics: as many metrics as are relevant to understand the long term health of the business and that are related to the product experience, but that are not actively being managed. Ranges that define a healthy metric should be set and metrics should be reviewed periodically to ensure that they stay within those healthy ranges. If a secondary metric is outside of a healthy range, the business should carefully consider the long term benefits and short term risks of allocating resources against improving that metric and if necessary, making changes to the primary metrics accordingly.
- Operational metrics: as many metrics and cuts of those metrics as are actionable to understand the product experience, that directly feed into the primary metric, and that are big enough to move that primary metric.
Conclusion
Metrics are incredibly powerful in understanding your product and defining your product strategy. But it’s important to select metrics carefully to make sure you spend your energy on what really matters to your business.