Without any configuration changes, Google Analytics provides a lot of insightful reports about your entire audience. But you can get much deeper insights if you segment your reports to compare across subsets of your audience. This tutorial will explain how to use segments in Google Analytics, specifically look at segmenting by device, time and region.
Introduction
Segments in Google Analytics are subsets of your data. The best way to explain how segments work is with an example. Consider this section from the Audience Overview report:

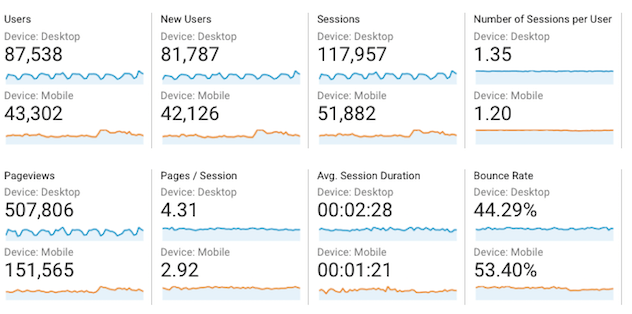
It provides high-level information about all of your users. But what if you wanted to see how performance differs between mobile and desktop traffic? Segmenting your report allows you to do just that:

In order to use Google Analytics, you have to set up analytics tracking on your site. In the examples we are using the Google demo account which is of the Google online property that sells Google-branded merchandise. If you want to follow along and have the data look the same, sign up for the demo account and in the date range in the reports select 1/1/2018 - 2/28/2018.
How to Segment by Device in Google Analytics
Segmenting your reports is very straight forward in Google Analytics. In fact, many segments are already be provided for you (either by default or created by your Google Analytics administrators).
To segment between desktop and mobile traffic follow these steps:
- Navigate to Audience - Overview report (or any report that has segments at the top)
- Click on “+ Add Segment” field
- In the demo account you’ll notice there already is a “Mobile Traffic” segment so you could simply select that one. But for purposes of the example we’ll create our own segment
- Click on the red “+ New Segment” button to get the segment builder
- Enter the segment name you want to use. Make sure it’s descriptive enough for you to be able to find it in the future. Here we’ll use “Device: Mobile”
- You’ll notice that there are lots of different dimensions you can select to create a segment. The one we’re looking for is in the Technology tab. Click on Technology
- Scroll to the “Device category” and select the type of match is one that “exactly matches”
- You’ll notice when you click on the text box that Google Analytics automatically provides the common choices for that field. Select “mobile”
- Click “Save”
- The report will automatically reload with two segments: “All Users” and “Device: Mobile”
- Repeat steps 2-9, this time creating the segment “Device: Desktop”
How to Segment by Region in Google Analytics
Another common segment for Google Analytics is to segment users by a geographical location. For example, let’s say your two biggest markets are the US and Canada, and you want to compare performance in those markets. To do so, follow these steps:
- Click on “+ Add Segment” field
- Click on the red “+ New Segment” button
- Enter the segment name you want to use. Here we’ll use “Region: US”
- Stay in the Demographics tab and scroll to “Location”
- Change the first dropdown from “Continent” to “Country”
- Change the next dropdown from “contains” to “exactly matches”
- Type out or select “United States”
- Click “Save”
- Repeat steps 1-8 for “Region: Canada”
Note that Google Analytics allows for different types of geographic aggregations (continents, countries, etc…). If you want to set up your own specific region information, you can follow these instructions.
How to Segment by Time of Day in Google Analytics
Many business experience different behavior by time of day. Say you have a morning peak and an afternoon peak and you want to compare how users in different times of the day behave.
This type of segment is a little more complex that the previous examples because there isn’t a pre-set selection for the “time” filter, but you can still easily add this filter by following these steps:
- Click on “+ Add Segment” field
- Click on the red “+ New Segment” button
- Enter the segment name you want to use. Here we’ll use “Time: Morning”
- Scroll to the “Advanced” - “Conditions” section
- Select whether you want to filter your users or sessions. Since “time” is a session dimension (a user can come to your site during more than one time bucket), we’ll select “Session”
- Next you can create a filter either by including all the sessions that match your condition or by excluding them. We’ll select “Include”
- The next drop down defaults to “Ad Content” but if you click in, you can navigate to any field that Google Analytics supports. We’ll select the “hour” field in the “Time” section
- Since Google Analytics recognizes that “hour” is numeric, the match type drop down changes to logical operators. To get “morning”, we want all sessions that started before noon, so select “<”
- In the text field type out “12”
- Click “Save”
- Repeat steps 1-10 for “Time: Afternoon” creating a segment with a filter where the “hour” is greater than or equal to 12.
The report will now compare the performance of users with sessions in the morning to those with sessions in the afternoon.
Conclusion
Using Google Analytics segments, you can cut your data by the dimensions that are most useful to your business.