What are active users?
The active users metric counts the number of unique users who engage with a web site or application within a particular period of time. Active user counts are a high level product metric to measure growth, churn, and product stickiness.
The criteria used to define a user as active will depend on the company and the product. For a website or application, activity could be defined as simply opening the site or app, require taking a specific action, or involves performing a certain number of actions. All users who perform the activity criteria are counted over a set amount of time. Common time periods and their abbreviations include:
- Daily Active Users (DAU): The number of unique users that interact with your product within a 24-hour window.
- Weekly Active Users (WAU): The number of unique users that interact with your product within a 7-day window.
- Monthly Active Users (MAU): The number of unique users that engage with your product within a 30-day window.
How to calculate active users
The steps to compute active users can be deceptively simple, but can become complicated depending on how activity is defined. We will walk through a simple example first and then delve into strategies for defining activity in the next section.
- Determine the criteria for an active user
- Determine the period of time you are interested in examining (e.g. day, week, month)
- Collect data, and sum the number of unique users who meet your active user criteria for each period of time.
Example:
- Criteria: user performs at least one action in the app (e.g. tapping a button, scrolling, swiping)
- Time Period: daily
- The following events are recorded for a particular day:
- User 1: pressed a button then closed the app
- User 2: Opened the app and took no action
- User 3: Opened the app, scrolled, swiped, and pressed a button
- User 1: Opens the app again and presses another button
- Result: 2 Daily Active Users:
- User 1: is an active user (but should only be counted once)
- User 2: is not considered active
- User 3: is an active user
Double-counting people is a common mistake if they take multiple actions. While it might be of interest to know whether certain users are highly active, making this kind of miscount will make your calculations of active users incorrect.
Defining active criteria
The most important decision in calculating active users is defining the criteria. There are many different ways to define an active user, but the goal is always the same. The point behind tracking active users is to make sure that the product or application is providing users continuing value. To determine what signals indicate user value, here are two strategies:
Be the user
Put yourself in your customers’ shoes by analyzing the features you enjoy from other, similar applications. Users stick to applications because they have irresistible features. Pay attention to how your feature usage varies between apps. For example, on Instagram, you are likely to be sharing pictures, using filters, adding tags and locations, and searching for other users. On Twitter, you will post comments and tweets, retweet your favorites, and follow trends in your region.
While Twitter’s success can be measured by the number of new accounts created or number of logins, Twitter really thrives thanks to continuous users who make posts, comment, and share. The same goes for Instagram. When you analyze your application, you need to identify the core features your users should come back for. In so doing, you can create a better definition for your active users, and use that to create a more valuable app.
Habit loop
If you know that certain activities users perform tend to bring them back to the website or app, you can use that action to define active users. While this may suit your business goals, this perspective can quickly become unaligned with the users and push you to make decisions that are only focused on addictive, short-term loops and not on valuable, long-term relationships. This lack of deep investment can end up pushing users away.
How to visualize active users
With the right data analysis tools, visualizing active users is easy. You can create different charts to display active users over given periods.
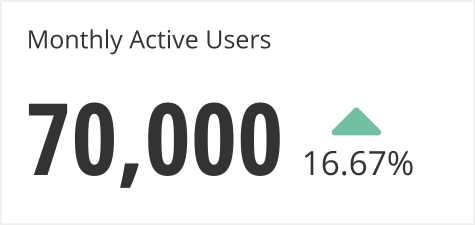
- Single Value charts can be used to show a current snapshot of Active User counts. It is also typically helpful to include an indicator showing how much the metric has changed from the previous time period to provide more context.

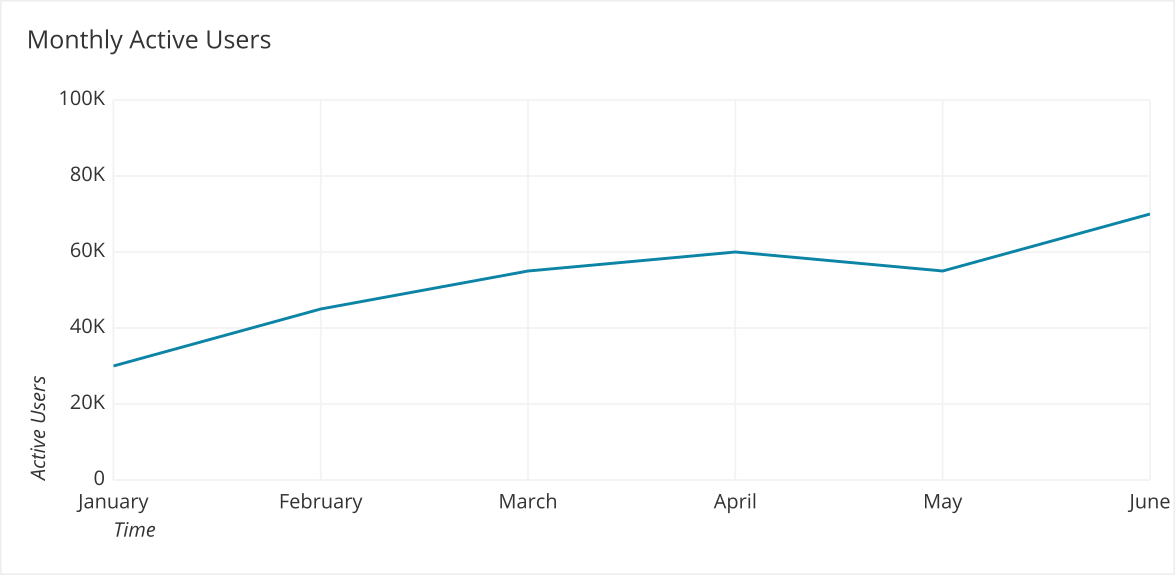
- Line charts can be used to show the number of active users over time. Be careful to not use a cumulative measure as this can mask when Active Users are declining.

Best practices for DAU and MAU
Tracking active users is very high level, and so should be used to understand high level trends and inform whether more analysis is needed.
High level trends
This data is a common request for any investor, employee, or general company stakeholder to know if the business is growing, flat, or declining. Prepare to share this data at least on a monthly basis with stakeholders.
Everyday use
This metric should be relatively stable day to day because people are creatures of habit. However, it should still be reviewed daily. Include active user count in a Product KPI Dashboard because if this metric changes a lot then very exciting or scary things are happening for your business.
- A large spike is good and we should figure out what caused it. Was it a new feature or an email campaign?
- A large dip means something went really wrong and we should also figure out what caused it. Is there is a bug in our tracking, did we lose a large client?
Related metrics
DAU to MAU ratio
The DAU to MAU ratio can be used to measure of your product’s stickiness. This ratio provides an indication of just how engaged your users are. If users only interact with your site or app a few times a month, this can result in a low DAU/MAU ratio. When users are highly engaged, interacting on most days, the DAU/MAU ratio will increase.

According to Sequoia Capital, applications with a 20% DAU/MAU are said to be good, while those with a 50%+ DAU/MAU are world-class. However this ratio can vary across industry. Facebook popularized this metric because its ratio has always been above 50%. According to Facebook, a user does not have to be on Facebook to be an active user. Their measures also include actions through third-party integrations. Here, they figured out users were getting value from Facebook in multiple ways. Always think about how measuring active users can be aligned with your specific users.
Retention and Churn
Customer Churn Rate (CCR) refers to the proportion of customers that stop using your product within a given time frame. A formerly active user is considered churned when they are no longer active for a prolonged period of time and thus considered to not be coming back. It is often better to focus on preventing churn than acquiring new customers. Looking at the active user count data by cohort can help give you insight. If there are certain points in the customer’s life cycle where users typically stop being active, you can create interventions there to help retain those users.
Criticism of Active Users
This metric can often be deceptive about how much users actually value your application. If the criteria is set up too loosely then you may be capturing people who are not actually engaged. If it is too strict or extensive, you might be missing capturing users who are getting value in a simpler way.